Image Details
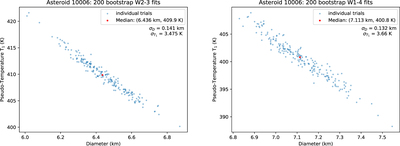
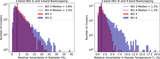
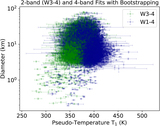
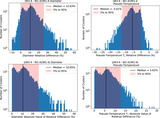
Caption: Figure 1.
Best-fit pseudo-temperature and diameter for 200 bootstrap trials for example asteroid 10006. The median is shown as a red dot, with corresponding parameter values displayed in the legend. Standard deviations in diameter and pseudo-temperature among the bootstrap trials are displayed below the legend. Left: results from two-band modeling. Right: results from four-band modeling, where we replicate the results from Myhrvold et al. (2022) with the same set of observational clusters but a different set of random bootstrap trials.
Other Images in This Article
Show More
Copyright and Terms & Conditions
© 2023. The Author(s). Published by the American Astronomical Society.
Copyright ©
2026 Astronomy Image Explorer. All Rights Reserved.