Image Details
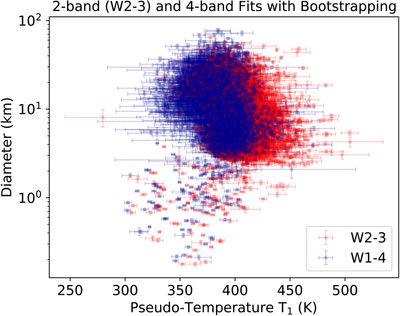
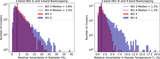
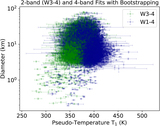
Caption: Figure 3.
Diameter vs. pseudo-temperature T 1 for 4542 cases calculated from a two-band (W2–3) least-squares solution and four-band (W1–4) regularized solution to a reparameterized NEATM model. Each point represents the median diameter and pseudo-temperature value among all accepted bootstrap trials for an object, while error bars represent the standard deviations of the diameter and pseudo-temperature values among accepted bootstrap trials. The W2–3 data shown in this figure are available as the data behind the figure. The data also includes additional information that will allow the reader to recreate Figures 4–6.
(The data used to create this figure are available.)
Other Images in This Article
Show More
Copyright and Terms & Conditions
© 2023. The Author(s). Published by the American Astronomical Society.