Image Details
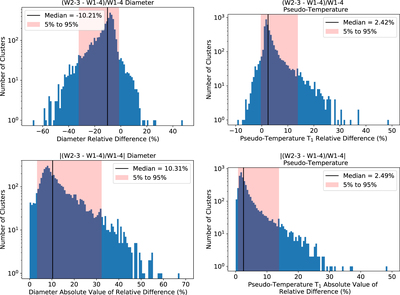
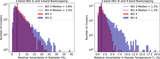
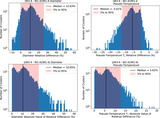
Caption: Figure 4.
Histograms of the relative difference and absolute value of the relative difference in D and T 1 parameter estimates. Median values are represented with a vertical black line, while a pink highlighted block is used to represent the 5%–95% quantile range. Top left: relative difference in diameter. Top right: relative difference in pseudo-temperature T 1. Bottom left: absolute value of relative difference in diameter. Bottom right: absolute value of relative difference in pseudo-temperature T 1.
Other Images in This Article
Show More
Copyright and Terms & Conditions
© 2023. The Author(s). Published by the American Astronomical Society.
Copyright ©
2026 Astronomy Image Explorer. All Rights Reserved.