

Image Details
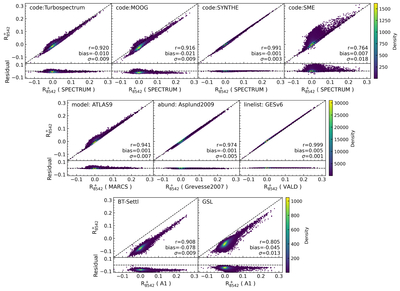
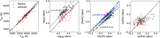
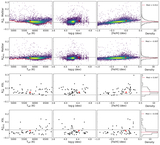
Caption: Figure 16.
Correlations and residuals of ﹩{R}_{8542}^{+}﹩ for the LAMOST sample derived using different synthesis configurations, all evaluated relative to the A1 templates (x-axis). In each case, only one component of the A1 configuration is changed in order to isolate the effect of that specific choice; the modified component is indicated in the upper-left corner of the first- and second-row panels. The lower row shows the results obtained with the BT-Settl and GSL libraries. The quantities r, bias, and σ denote the correlation coefficient, mean residual, and standard deviation of the residuals, respectively.
Other Images in This Article
Show More
Copyright and Terms & Conditions
© 2026. The Author(s). Published by the American Astronomical Society.

