

Image Details
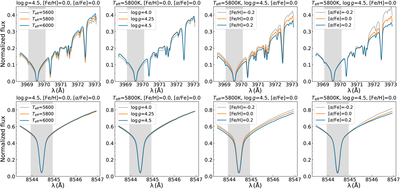
Caption: Figure 4.
Variations in the normalized Ca II H & K and IRT line profiles as a function of Teff, ﹩\mathrm{log}g﹩, [Fe/H], and [α/Fe], using synthetic spectra computed with the A1 configuration. The upper panels show the Ca II H line, and the lower panels show the λ8542 line. Fixed parameters are listed in the panel titles, while the varying parameter in each panel is indicated by color. The adopted parameter steps are ΔTeff = 200 K, ﹩{\rm{\Delta }}\mathrm{log}g=0.25﹩ dex, Δ[Fe/H]=0.2 dex, and Δ[α/Fe] = 0.2 dex. Vmic and Vmac are held fixed. The gray shaded region marks the 1 Å line-core window. All wavelengths are given in vacuum, and the spectral resolving power is 300,000.
Other Images in This Article
Show More
Copyright and Terms & Conditions
© 2026. The Author(s). Published by the American Astronomical Society.

