

Image Details
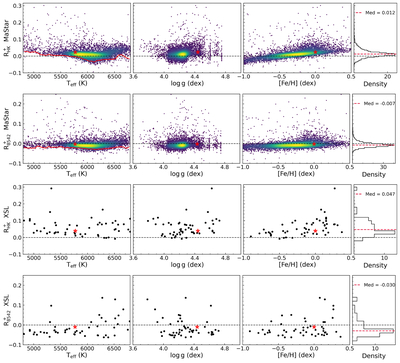
Caption: Figure 9.
﹩{R}_{{\rm{HK}}}^{+}﹩ and ﹩{R}_{8542}^{+}﹩ as functions of Teff, ﹩\mathrm{log}g﹩, and [Fe/H] for the MaStar and XSL samples, derived using the A1 templates with ﹩{V}_{{\rm{mic}}}={V}_{{\rm{mic}}}^{{\rm{t}}}﹩. The upper two rows show the MaStar sample, and the lower two rows show the XSL sample. The red star marks the Sun. In the Teff panels, the red curve denotes the 5th percentile relation. High-density regions are shown in yellow, and the median lines are plotted in red. The black horizontal dashed line indicates R+ = 0.
Other Images in This Article
Show More
Copyright and Terms & Conditions
© 2026. The Author(s). Published by the American Astronomical Society.

Copyright ©
2026 Astronomy Image Explorer. All Rights Reserved.
