

Image Details
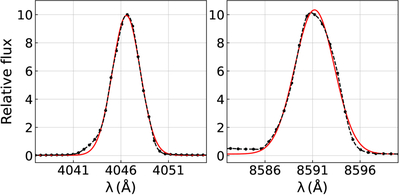
Caption: Figure 2.
LAMOST arc-lamp emission lines. The left panel shows the profile of the 4046.6 Å line and the right panel shows the profile of the 8591.3 Å line. Black points: arc-lamp spectrum; black dashed curve: cubic-spline interpolation; red curve: fitted Gaussian.
Other Images in This Article
Show More
Copyright and Terms & Conditions
© 2026. The Author(s). Published by the American Astronomical Society.

Copyright ©
2026 Astronomy Image Explorer. All Rights Reserved.
