

Image Details
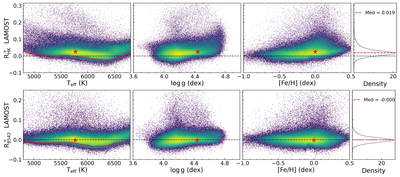
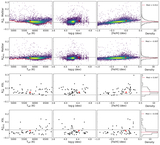
Caption: Figure 3.
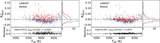
﹩{R}_{{\rm{HK}}}^{+}﹩ and ﹩{R}_{8542}^{+}﹩ as functions of Teff, ﹩\mathrm{log}g﹩, and [Fe/H] for the LAMOST sample, derived using the A1 templates with ﹩{V}_{{\rm{mic}}}={V}_{{\rm{mic}}}^{{\rm{t}}}﹩. The upper panels show ﹩{R}_{{\rm{HK}}}^{+}﹩, and the lower panels show ﹩{R}_{8542}^{+}﹩. The red star marks the Sun, for which ﹩{R}_{{\rm{HK}}}^{+}=0.0252﹩ and ﹩{R}_{8542}^{+}=-0.0018﹩. In the Teff panels, the red curve denotes the 5th percentile relation. High-density regions are shown in yellow, and the median lines are plotted in red. The black horizontal dashed line indicates R+ = 0.
Other Images in This Article
Show More
Copyright and Terms & Conditions
© 2026. The Author(s). Published by the American Astronomical Society.

Copyright ©
2026 Astronomy Image Explorer. All Rights Reserved.
