

Image Details
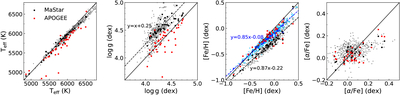
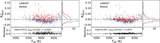
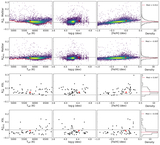
Caption: Figure 5.
Atmospheric-parameter comparison for cross-matched samples. LAMOST parameters are shown on the x-axis, while the corresponding MaStar and APOGEE parameters are shown on the y-axis. Gray: LAMOST–MaStar cross-match. Large squares: LAMOST–MaStar–APOGEE triple match, with APOGEE parameters in red and MaStar median parameters in black. Blue points in [Fe/H] show MaStar [Fe/H]cal. Solid black line: y = x; dashed line: estimated relation between MaStar and LAMOST parameters.
Other Images in This Article
Show More
Copyright and Terms & Conditions
© 2026. The Author(s). Published by the American Astronomical Society.

Copyright ©
2026 Astronomy Image Explorer. All Rights Reserved.
