

Image Details
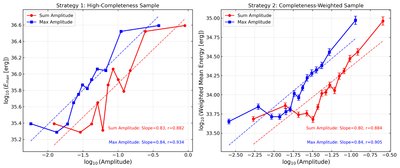
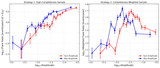
Caption: Figure 9.
Relationship between starspot amplitude and flare energy. Left panel (Strategy 1): maximum flare energy (﹩{E}_{\max }﹩) within each amplitude bin for the high-completeness sample. Right panel (Strategy 2): completeness-weighted mean energy within each amplitude bin for the broad sample. In both panels, red circles represent the sum amplitude, and blue squares represent the maximum amplitude. Dashed lines indicate the linear fits to the binned data.
Other Images in This Article
Show More
Copyright and Terms & Conditions
© 2026. The Author(s). Published by the American Astronomical Society.

Copyright ©
2026 Astronomy Image Explorer. All Rights Reserved.
