

Image Details
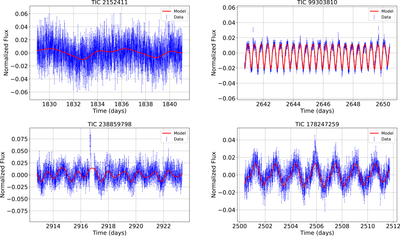
Caption: Figure 2.
Examples of starspot modeling for different TIC targets. Subplots display normalized flux data and fitted starspot models for (a) TIC 2152411, (b) TIC 99303810, (c) TIC 238859798, and (d) TIC 178247259. Blue points with error bars represent the normalized flux, while red solid lines show the best-fit starspot model curves. The horizontal axis represents the observation time in days, showing the temporal evolution of stellar brightness variations.
Other Images in This Article
Show More
Copyright and Terms & Conditions
© 2026. The Author(s). Published by the American Astronomical Society.

Copyright ©
2026 Astronomy Image Explorer. All Rights Reserved.
