

Image Details
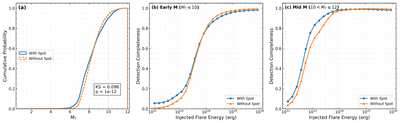
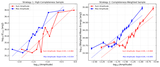
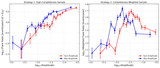
Caption: Figure 8.
(a) Cumulative distributions of absolute TESS magnitudes for spotted and non-spotted stars. (b), (c) Detection completeness for spotted (blue circles) and non-spotted (orange triangles) stars, computed separately for the (b) early M (MT ≤ 10) and (c) mid-M (10 < MT ≤ 12) subgroups. In both groups, spotted stars show higher completeness at low energies.
Other Images in This Article
Show More
Copyright and Terms & Conditions
© 2026. The Author(s). Published by the American Astronomical Society.

Copyright ©
2026 Astronomy Image Explorer. All Rights Reserved.
