

Image Details
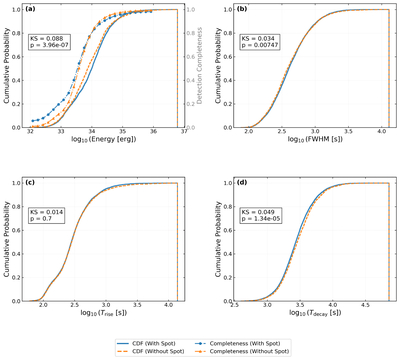
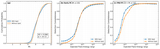
Caption: Figure 7.
Comparison of cumulative distribution functions (CDFs) for event characteristics with and without optical spots. Subplots display distributions on a logarithmic scale for (a) energy, (b) FWHM, (c) rise time (Trise), and (d) decay time (Tdecay). Each subplot includes the two-sample K-S test statistic and corresponding p-value. Blue solid lines represent CDFs for the sample with spots, while orange dashed lines correspond to the sample without spots. In panel (a), the detection completeness curves derived from our injection-recovery test are overplotted on the right y-axis using dashed–dotted lines with markers (blue circles: with spot; orange triangles: without Spot).
Other Images in This Article
Show More
Copyright and Terms & Conditions
© 2026. The Author(s). Published by the American Astronomical Society.

