

Image Details
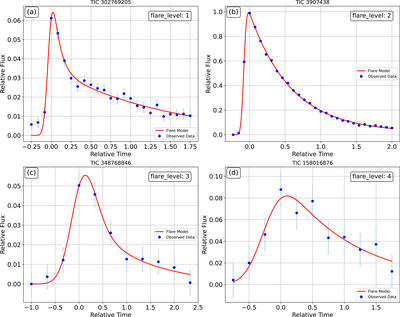
Caption: Figure 1.
Examples of identified flare events. Subplots display observed flux data and fitted flare models for (a) TIC 302769205, (b) TIC 3907438, (c) TIC 348768846, and (d) TIC 158016876. Blue points with error bars represent the observed flux measurements, while red solid lines show the best-fit flare model curves. Each subplot includes the flare classification level (flare_level) in the upper right corner, indicating the confidence of flare detection.
Other Images in This Article
Show More
Copyright and Terms & Conditions
© 2026. The Author(s). Published by the American Astronomical Society.

Copyright ©
2026 Astronomy Image Explorer. All Rights Reserved.
