

Image Details
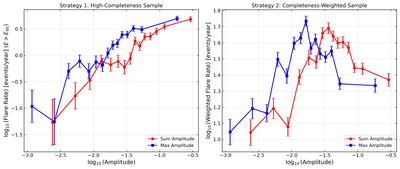
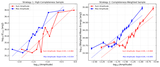
Caption: Figure 10.
Relationship between starspot amplitude and flare rate. Left panel (Strategy 1): occurrence rate of flares strictly above the 95% completeness threshold (E > E95). Right panel (Strategy 2): completeness-weighted total flare rate. In both panels, red circles represent the sum amplitude, and blue squares represent the maximum amplitude. Error bars indicate the statistical uncertainties derived from Poisson statistics (left) and completeness-weight propagation (right).
Other Images in This Article
Show More
Copyright and Terms & Conditions
© 2026. The Author(s). Published by the American Astronomical Society.

Copyright ©
2026 Astronomy Image Explorer. All Rights Reserved.
