

Image Details
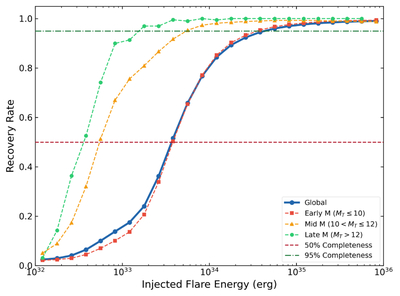
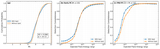
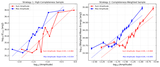
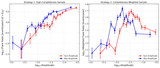
Caption: Figure 3.
Flare detection completeness derived from injection-recovery tests. The solid blue curve with circles represents the global detection completeness as a function of injected flare energy, while the dashed curves represent the completeness grouped by stellar absolute TESS magnitude (MT). The red and green horizontal lines indicate the 50% and 95% completeness levels, respectively. The 95% completeness limit shifts dramatically toward higher energies for brighter stars due to decreased flare contrast.
Other Images in This Article
Show More
Copyright and Terms & Conditions
© 2026. The Author(s). Published by the American Astronomical Society.

Copyright ©
2026 Astronomy Image Explorer. All Rights Reserved.
