

Image Details
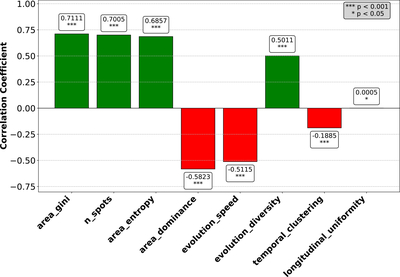
Caption: Figure A1.
Correlation coefficients between various starspot distribution features and complexity, with statistical significance indicators. Green bars represent positive correlations, while red bars indicate negative correlations. The variables analyzed include area distribution metrics (Gini coefficient, entropy, dominance), spot characteristics (number of spots, uniformity), and evolutionary patterns (speed, diversity, clustering). Each bar is annotated with the correlation value and significance level (*** for p < 0.001, * for p < 0.05). A horizontal zero line provides a reference for correlation direction interpretation.
Other Images in This Article
Show More
Copyright and Terms & Conditions
© 2026. The Author(s). Published by the American Astronomical Society.

