

Image Details
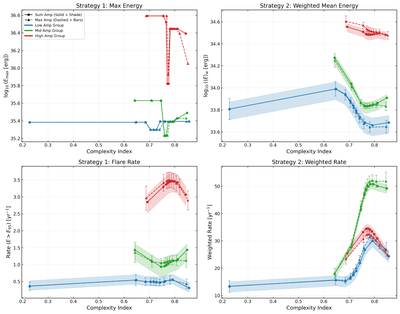
Caption: Figure 16.
Relationships between starspot complexity and flare properties within different amplitude subgroups. The sample is divided into three equal-numbered subgroups based on both the sum of spot amplitudes (low: A < 0.022, mid: 0.022 ≤ A < 0.055, high: A ≥ 0.055) and the maximum spot amplitude (low: A < 0.010, mid: 0.010 < A < 0.025, high: A > 0.025). Results based on the sum of amplitudes are shown as solid lines with circle markers and shaded uncertainty regions, while results based on the maximum amplitude are shown as dashed lines with triangle markers and error bars. Top-left panel: maximum flare energy (﹩{E}_{\max }﹩, Strategy 1) vs. complexity. Top-right panel: completeness-weighted mean energy (﹩{\overline{E}}_{w}﹩, Strategy 2) vs. complexity. Bottom-left panel: high-energy flare rate (E > E95, Strategy 1) vs. complexity. Bottom-right panel: completeness-weighted total flare rate (Strategy 2) vs. complexity. Blue, green, and red colors represent the low-, mid-, and high-amplitude groups, respectively.
Other Images in This Article
Show More
Copyright and Terms & Conditions
© 2026. The Author(s). Published by the American Astronomical Society.

