

Image Details
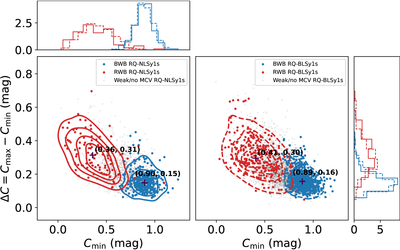
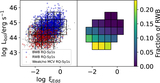
Caption: Figure 6.
Distribution of the minimum MIR color (﹩{C}_{{\rm{\min }}}﹩) vs. the maximum color variation (﹩{\rm{\Delta }}C={C}_{{\rm{\max }}}-{C}_{{\rm{\min }}}﹩) for the Seyfert 1 sample. The populations are categorized into RWB RQ Seyfert 1s (red), BWB RQ Seyfert 1s (blue), and weak or no MCV RQ Seyfert 1s (gray). The distinct clustering of BWB sources at redder colors and RWB sources at larger variation ranges highlights the impact of host-galaxy contamination on the observed MIR color trends.
Other Images in This Article
Show More
Copyright and Terms & Conditions
© 2026. The Author(s). Published by the American Astronomical Society.

Copyright ©
2026 Astronomy Image Explorer. All Rights Reserved.
