

Image Details
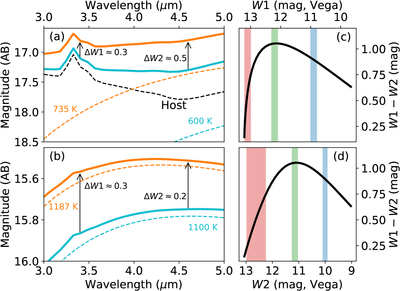
Caption: Figure 10.
Schematic illustration of the host-contaminated dust reprocessing model presented in Paper I. Panels (a) and (b) show the SED evolution for cases with higher and lower host contributions, respectively, with the y-axis in AB magnitudes. The model parameters are identical to those used in Figure 6 of Paper I. The black dashed lines represent the host from the spiral-galaxy template of R. J. Assef et al. (2010), while the cyan and orange dashed lines denote the low- and high-temperature blackbody components; the corresponding solid lines show the total flux. The temperature variations yield ΔW1 ∼ 0.3 mag in both cases, while ΔW2 = 0.5 and 0.2 mag for panels (a) and (b), respectively, indicating RWB (ΔW2 > ΔW1) and BWB (ΔW2 < ΔW1) behavior. Panels (c) and (d) show the color–magnitude relation generated by the Paper I model, with W1 − W2 plotted against W1 and W2, respectively. Panel (c) shows the RWB (red), weak or no MCV (green), and BWB (blue) regimes, with shaded vertical bands indicating an identical W1 variability amplitude; panel (d) shows the corresponding W2 responses. The steep RWB relation allows sources with different MCV trends to exhibit more distinct W2 responses, thereby producing a stronger anticorrelation between σm[W2] and ρPearson.
Other Images in This Article
Show More
Copyright and Terms & Conditions
© 2026. The Author(s). Published by the American Astronomical Society.

