

Image Details
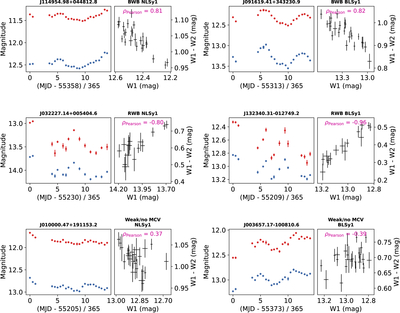
Caption: Figure 2.
Example MIR light curves for each classification in Section 3. For each panel, light curves (left; blue in the W1 band and red in the W2 band) and color variations following the photometric magnitudes in the W1 band (right) are shown.
Other Images in This Article
Show More
Copyright and Terms & Conditions
© 2026. The Author(s). Published by the American Astronomical Society.

Copyright ©
2026 Astronomy Image Explorer. All Rights Reserved.
