

Image Details
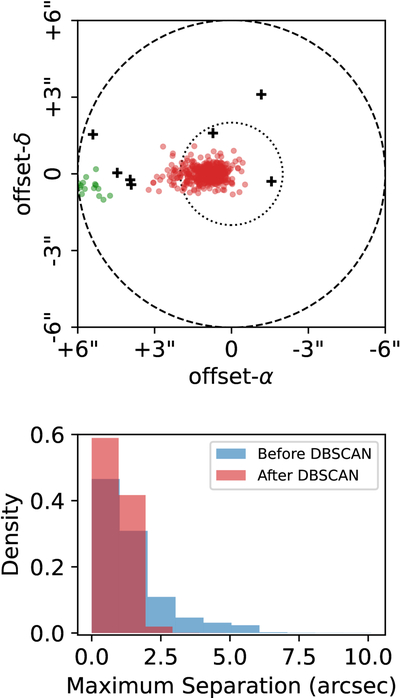
Caption: Figure 1.
Spatial clustering and cleaning of WISE photometry. Upper panel: illustrative example of the DBSCAN algorithm applied to the NLSy1 source SDSS J120847.81+671833.8 (z = 0.249). The axes represent positional offsets relative to the SDSS optical coordinates. The inner and outer dashed circles indicate search radii of 2″ and 6″, respectively. Red circles identify detections associated with the target AGN, while green circles denote classified contaminants (from galaxy SDSS J120849.12+671832.7). Black plus signs represent data points identified as noise by the algorithm. Lower panel: distributions of the maximum angular separation between individual WISE photometric detections and the median WISE coordinate for the entire sample. The blue histogram represents the distribution following initial crossmatching and quality filtering, while the red histogram shows the significant reduction in positional scatter after applying the DBSCAN cleaning procedure.
Other Images in This Article

Show More
Copyright and Terms & Conditions
© 2026. The Author(s). Published by the American Astronomical Society.

