

Image Details
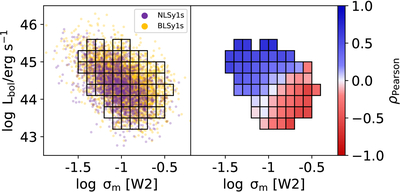
Caption: Figure 5.
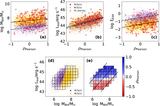
Dependence of MCV behavior on intrinsic variability and bolometric luminosity. Left: distribution of individual RQ Seyfert 1s in the Lbol–σm[W2] parameter space. Rectangular bins indicate the 0.3 × 0.3 dex regions used for ensemble analysis. Right: median ρPearson for each bin, demonstrating that the negative correlation between σm[W2] and ρPearson persists even after controlling for Lbol.
Other Images in This Article
Show More
Copyright and Terms & Conditions
© 2026. The Author(s). Published by the American Astronomical Society.

Copyright ©
2026 Astronomy Image Explorer. All Rights Reserved.
