

Image Details
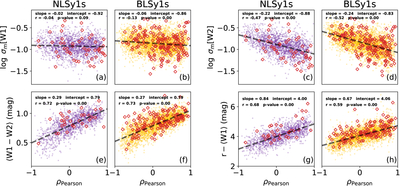
Caption: Figure 3.
Correlations between the MCV coefficient ρPearson and MIR variability properties. (a)–(d) ρPearson vs. intrinsic variability amplitude σm in the W1 and W2 bands for NLSy1s and BLSy1s. (e)–(f) ρPearson vs. mean MIR color ﹩\left\langle {\rm{W}}1-{\rm{W}}2\right\rangle ﹩. (g)–(h) ρPearson vs. the host-contamination proxy ﹩r-\left\langle {\rm{W}}1\right\rangle ﹩. Purple and orange points denote RQ NLSy1s and RQ BLSy1s, respectively; red diamonds indicate RL counterparts. Dashed lines represent linear regression fits for the RQ populations.
Other Images in This Article
Show More
Copyright and Terms & Conditions
© 2026. The Author(s). Published by the American Astronomical Society.

Copyright ©
2026 Astronomy Image Explorer. All Rights Reserved.
