

Image Details
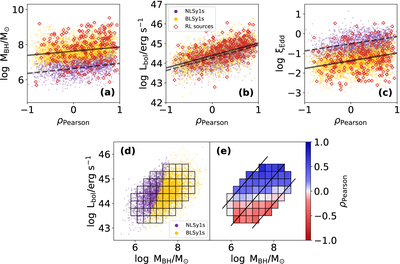
Caption: Figure 4.
Correlations between the MCV coefficient ρPearson and fundamental AGN parameters for the Seyfert 1 sample. (a)–(c) ρPearson as a function of black hole mass (MBH), bolometric luminosity (Lbol), and Eddington ratio (ξEdd). Symbol and color definitions are the same as in Figure 3. The linear regression results for the RQ population are shown by dashed (NLSy1) and solid (BLSy1) lines. (d) Distribution of RQ Seyfert 1 (RQ Seyfert 1) galaxies in the MBH–Lbol plane. The grid represents bins of 0.3 × 0.3 dex, with only bins containing ≥20 sources shown. (e) Median ρPearson calculated within each bin, with color coding indicating the dominant variability trend (BWB vs. RWB). Diagonal lines represent loci of constant ξEdd, with values increasing from the bottom right to the top left.
Other Images in This Article
Show More
Copyright and Terms & Conditions
© 2026. The Author(s). Published by the American Astronomical Society.

