

Image Details
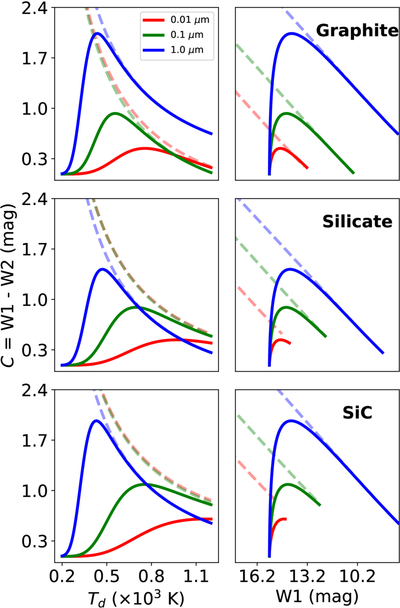
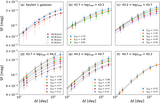
Caption: Figure 11.
Modeled MIR color properties for various dust compositions and grain radii. Left column: MIR color (C = W1 − W2) as a function of dust temperature (Td) for the modified blackbody model. Each row represents a specific dust composition: graphite (top), silicates (middle), and silicon carbide (bottom). Colored lines denote different grain radii (a), as indicated in the legend. The dashed black line in each panel represents the intrinsic dust color without host starlight contamination (Finvar = 0). Right column: corresponding color–magnitude diagrams showing C as a function of W1 magnitude, calculated under the same model assumptions.
Other Images in This Article
Show More
Copyright and Terms & Conditions
© 2026. The Author(s). Published by the American Astronomical Society.

