

Image Details
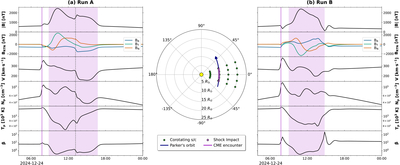
Caption: Figure 13.
Simulated Parker Solar Probe measurements of the (a) Run A and (b) Run B CMEs using the Encounter #22 trajectory. The in situ profiles show, from top to bottom: the magnetic field magnitude, magnetic field components in RTN coordinates, solar wind speed, density, temperature, and plasma beta. CME-driven sheaths are marked by solid vertical lines, while CME flux rope intervals are indicated by shaded regions. The dashed vertical line in (a) highlights an “ambiguous” discontinuity region separating the two field magnitude enhancements. The central inset shows the Parker Solar Probe trajectory (in the Carrington frame) projected onto the equatorial plane, with the shock impact and CME passage (averaged between the two cases) times marked, together with the positions of the corotating synthetic spacecraft analyzed throughout this work.
Other Images in This Article
Show More
Copyright and Terms & Conditions
© 2026. The Author(s). Published by the American Astronomical Society.

