

Image Details
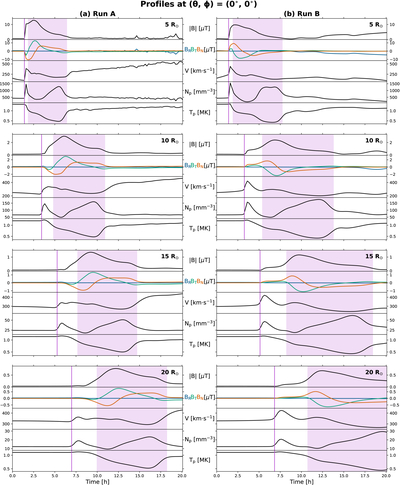
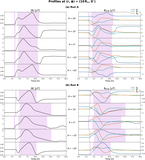
Caption: Figure 3.
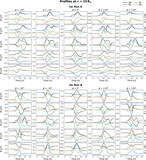
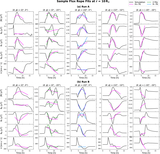
Synthetic spacecraft profiles for fixed (θ, ϕ) = (0∘, 0∘) at four radial distances (5, 10, 15, 20 R⊙) for (a) Run A and (b) Run B. Each plot shows, from top to bottom: magnetic field magnitude, magnetic field components in RTN coordinates, solar wind speed, density, and temperature. CME-driven sheaths are marked by vertical lines, while CME flux rope intervals are indicated by shaded areas. The y-axes are scaled uniformly across each row to highlight differences between the two runs.
Other Images in This Article
Show More
Copyright and Terms & Conditions
© 2026. The Author(s). Published by the American Astronomical Society.

Copyright ©
2026 Astronomy Image Explorer. All Rights Reserved.
