

Image Details
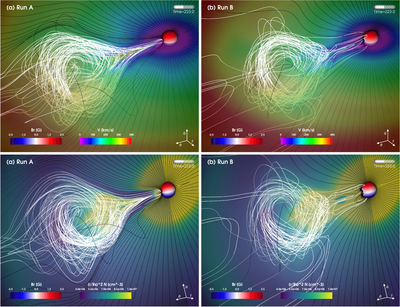
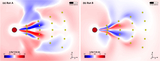
Caption: Figure 1.
Overview of the two simulated CMEs investigated in this study: (a) Run A and (b) Run B. In all panels, representative magnetic field lines are shown, colored to approximately distinguish between the (black) ambient coronal magnetic field and the (white) CME flux rope. The top panels show the field lines overlaid on the equatorial solar wind speed, while the bottom panels show them together with the (scaled) coronal density in the meridional plane containing the fictitious Sun–Earth line.
Other Images in This Article
Show More
Copyright and Terms & Conditions
© 2026. The Author(s). Published by the American Astronomical Society.

Copyright ©
2026 Astronomy Image Explorer. All Rights Reserved.
