

Image Details
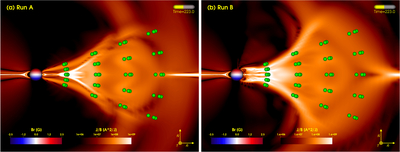
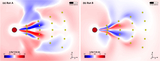
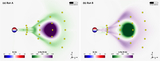
Caption: Figure 2.
Spatial distribution of the synthetic spacecraft for (a) Run A and (b) Run B projected onto the meridional plane at ϕ = 0∘. The virtual probes are represented by green spheres. The meridional plane is shown by means of the normalized current density ∣J/B∣ at t ≃ 9.5 hr, i.e., when the CME apex reaches r ≃ 20 R⊙ in either run. The animated version of this figure shows the evolution of ∣J/B∣ throughout the temporal domain of the simulations from 0 to 20 hr, corresponding to code units from 200.0 to 250.0 in increments of 0.5 (12 minutes). The animation has a total real-time duration of 7 s.
(An animation of this figure is available in the online article.)
(An animation of this figure is available.)
The video/animation of this figure is available in the online journal.
Other Images in This Article
Show More
Copyright and Terms & Conditions
© 2026. The Author(s). Published by the American Astronomical Society.

