

Image Details
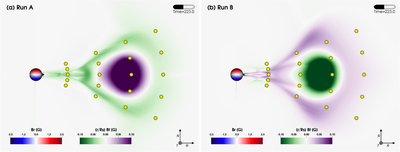
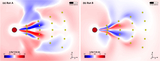
Caption: Figure 9.
Snapshot (at t ≃ 9.5 hr) of the scaled tangential magnetic field component (BT) for (a) Run A and (b) Run B projected onto the meridional plane at ϕ = 0∘. The synthetic spacecraft that cross the meridional plane are represented by yellow spheres. The animated version of this figure shows the evolution of BT throughout the temporal domain of the simulations from 0 to 20 hr, corresponding to code units from 200.0 to 250.0 in increments of 0.5 (12 minutes). The animation has a total real-time duration of 7 s.
(An animation of this figure is available in the online article.)
(An animation of this figure is available.)
The video/animation of this figure is available in the online journal.
Other Images in This Article
Show More
Copyright and Terms & Conditions
© 2026. The Author(s). Published by the American Astronomical Society.

