

Image Details
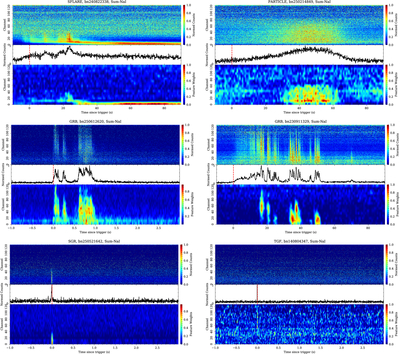
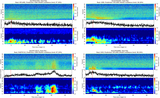
Caption: Figure 1.
Representative samples of the five trigger classes with Grad-CAM feature visualizations. For each event, the top panel shows the normalized multichannel (128 energy bins) count map, the middle panel shows the summed light curve across all energy channels, and the bottom panel displays the Grad-CAM heatmap, highlighting the spatiotemporal features (time–energy bins) that most influenced the model’s classification.
Other Images in This Article
Copyright and Terms & Conditions
© 2026. The Author(s). Published by the American Astronomical Society.

Copyright ©
2026 Astronomy Image Explorer. All Rights Reserved.
