

Image Details
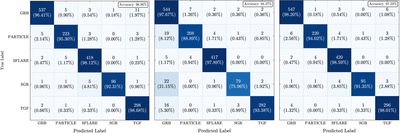
Caption: Figure 3.
Confusion matrices evaluated on the held-out test set for the best-performing long-scale model LNaI-128C,BGO-128C (left), short-scale model SNaI-128C (middle), and dual-scale fused model FNaI-128C,BGO-128C (right). Rows correspond to the true trigger classes and columns to the model-predicted classes. Each cell reports the number of events, with the corresponding fraction relative to the true class shown in parentheses. The overall classification accuracy for each model is indicated in the upper-right corner of each panel.
Other Images in This Article
Copyright and Terms & Conditions
© 2026. The Author(s). Published by the American Astronomical Society.

Copyright ©
2026 Astronomy Image Explorer. All Rights Reserved.
