

Image Details
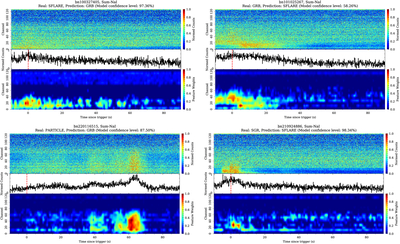
Caption: Figure A1.
Representative Grad-CAM visualizations for incorrectly classified triggers. For each event, the title gives the trigger name, the catalog label, the model prediction, and the corresponding model confidence. In each panel, the top subpanel shows the normalized multichannel count map with 128 energy bins, the middle subpanel shows the summed light curve over all energy channels, and the bottom subpanel shows the Grad-CAM heatmap. The heatmap highlights the time–energy regions that contribute most strongly to the model prediction. These examples illustrate that misclassifications often arise from ambiguous or class-overlapping temporal–spectral structures rather than from a single obvious image artifact.
Other Images in This Article
Copyright and Terms & Conditions
© 2026. The Author(s). Published by the American Astronomical Society.

