

Image Details
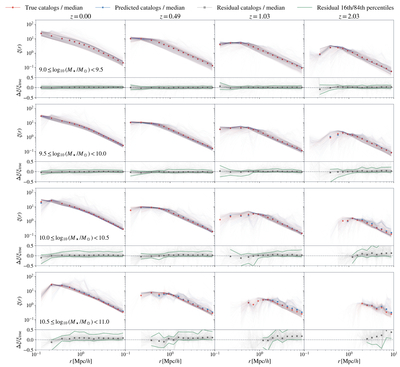
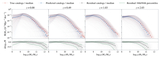
Caption: Figure 6.
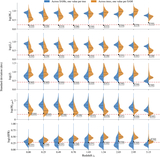
Two-point correlation functions across four redshift outputs. Each pair of rows corresponds to one stellar-mass bin: the upper panels compare the predicted and true functions for the 600 test SAM catalogs, while the lower panels show the fractional residuals and their median and 16th–84th percentile range. The agreement is generally good over the intermediate scales and mass ranges. The largest deviations occur in the highest-mass and highest-redshift bins, where the galaxy sample is sparse. In addition, the limited simulation volume (100 Mpc/h on a side) reduces the number of close galaxy pairs on small scales and the number of independent modes on large scales, making the clustering estimates noisier at both ends of the scale range. Nevertheless, the overall consistency between the SAM catalog and the GNN prediction demonstrates that the surrogate captures the main clustering behavior of the underlying model.
Other Images in This Article
Show More
Copyright and Terms & Conditions
© 2026. The Author(s). Published by the American Astronomical Society.

