

Image Details
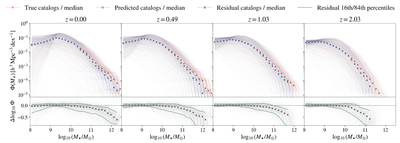
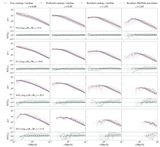
Caption: Figure 5.
Stellar-mass functions of the 600 test SAM catalogs at four redshift outputs. Faint red and blue curves show the true and predicted functions of individual catalogs, and the corresponding markers show their medians. The flattening and decline at the lower-mass end is simply caused by the resolution and incompleteness of the simulation. The lower panels show ﹩{\rm{\Delta }}{\mathrm{log}}_{10}{\rm{\Phi }}﹩ for individual catalogs, with gray squares and green curves denoting the median and the 16th and 84th percentiles, respectively.
Other Images in This Article
Show More
Copyright and Terms & Conditions
© 2026. The Author(s). Published by the American Astronomical Society.

Copyright ©
2026 Astronomy Image Explorer. All Rights Reserved.
