

Image Details
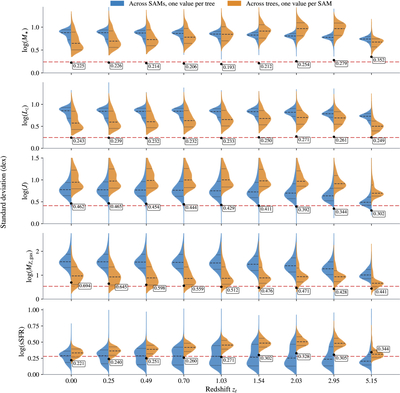
Caption: Figure 10.
Continuous scatter distributions for the five target properties across the nine redshift outputs. In each row, the left half violin shows the distribution, over 20,000 fixed test trees, of the standard deviation measured across 600 test SAM catalogs. The right half violin shows the distribution, over those 600 test SAM catalogs, of the standard deviation measured across the same fixed-tree set. The horizontal reference line marks the prediction scatter for that property on the test set averaged over redshift, while points and numeric labels mark the corresponding prediction scatter at each redshift. For sSFR, quenched systems are excluded from the continuous summary; for MZ,gas, systems at the floor branch are excluded.
Other Images in This Article
Show More
Copyright and Terms & Conditions
© 2026. The Author(s). Published by the American Astronomical Society.

