

Image Details
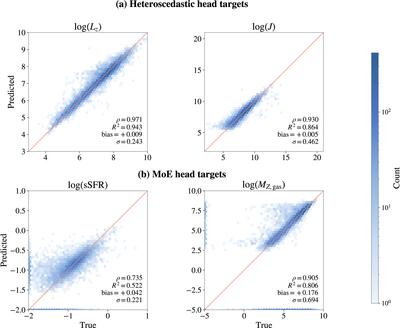
Caption: Figure 8.
Predicted versus true values at z1 = 0 for the four remaining targets. The upper row shows Lz and J, and the lower row shows sSFR and MZ,gas. The one-to-one line is shown in orange in each panel.
Other Images in This Article
Show More
Copyright and Terms & Conditions
© 2026. The Author(s). Published by the American Astronomical Society.

Copyright ©
2026 Astronomy Image Explorer. All Rights Reserved.
