

Image Details
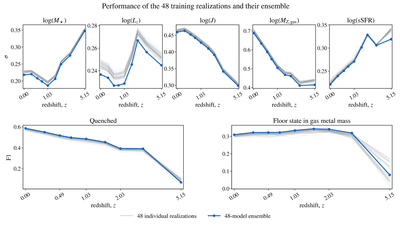
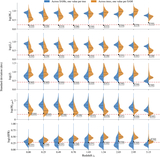
Caption: Figure 9.
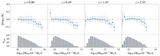
Performance of the models from the 48 training realizations and their ensemble across redshift. Each pale line shows one individual model, while the blue line shows the average of the 48-model ensemble. The upper panels report the continuous scatter σ; the lower panels report the F1 score for the quenched state and the floor state in gas metal mass.
Other Images in This Article
Show More
Copyright and Terms & Conditions
© 2026. The Author(s). Published by the American Astronomical Society.

Copyright ©
2026 Astronomy Image Explorer. All Rights Reserved.
