

Image Details
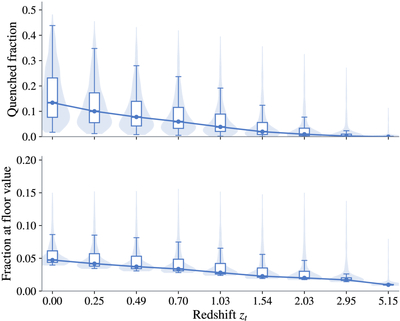
Caption: Figure 11.
Catalog-level fractions for the mass-selected sample as a function of redshift. The upper panel shows the quenched fraction and the lower panel shows the fraction of systems at the floor value in gas metal mass. At each redshift, the violin indicates the full distribution across catalogs, the box marks the interquartile range, and the central line marks the median.
Other Images in This Article
Show More
Copyright and Terms & Conditions
© 2026. The Author(s). Published by the American Astronomical Society.

Copyright ©
2026 Astronomy Image Explorer. All Rights Reserved.
