

Image Details
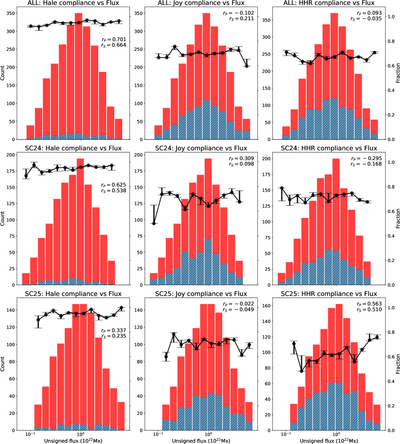
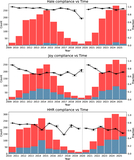
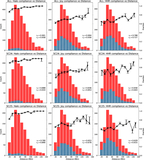
Caption: Figure 6.
Frequency distribution of ARs with respect to total unsigned magnetic flux. The left, middle, and right columns show the compliance state with Hale’s law, Joy’s law, and the HHR, respectively, for the full dataset (top row), SC24 (middle row), and SC25 (bottom row). The red (blue) bars, as scaled by the left y-axis, represent the number of ARs that obey (violate) the empirical laws; black dots, as scaled by the right y-axis, show the compliance rate in each individual flux bin. The Pearson correlation coefficient (rP) and the Spearman rank correlation coefficient (rS) between compliance rate and total unsigned flux are annotated in each panel. Error bars show the range of compliance rates obtained by varying the magnetic field threshold, the AR patch size, and the cycle boundary, as described in Section 2.
Other Images in This Article
Copyright and Terms & Conditions
© 2026. The Author(s). Published by the American Astronomical Society.

