

Image Details
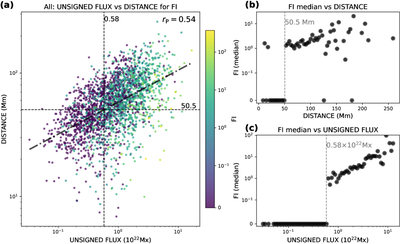
Caption: Figure 7.
The distribution of FI with respect to centroid distance and unsigned flux. (a) Scatter plot of unsigned flux versus centroid distance for all ARs, color coded by FI. The vertical and horizontal dashed lines mark the flux and distance thresholds identified from the binned median FI distributions in panels (b) and (c). The dotted–dashed line indicates the linear fitting between unsigned flux and centroid distance, while the Pearson correlation coefficient (rP) is shown in the upper right corner. The distribution of median FI with respect to centroid distance (b) and unsigned flux (c), respectively, is computed within each individual bin; the dashed line indicates the distance and flux threshold at which the binned median FI shows a jump.
Other Images in This Article
Copyright and Terms & Conditions
© 2026. The Author(s). Published by the American Astronomical Society.

