

Image Details
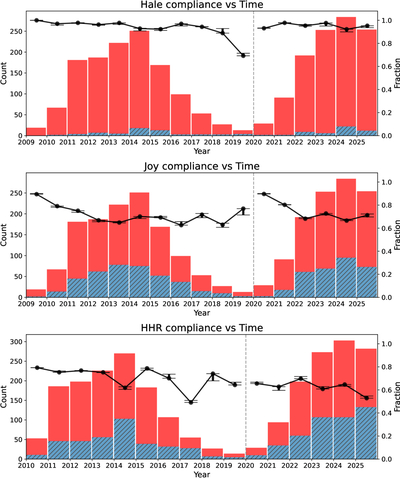
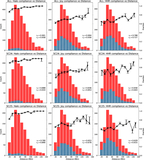
Caption: Figure 4.
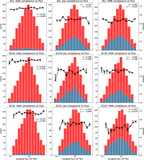
Frequency distribution of ARs that obey/violate Hale’s law (top), Joy’s law (middle), and the HHR (bottom), respectively. The red (blue) bars, as scaled by the left y-axis, represent the number of ARs that obey (violate) the empirical laws; black dots, as scaled by the right y-axis, show the yearly compliance rate. Error bars show the range of compliance rates obtained by varying the magnetic field threshold, the AR patch size, and the cycle boundary, as described in Section 2.
Other Images in This Article
Copyright and Terms & Conditions
© 2026. The Author(s). Published by the American Astronomical Society.

Copyright ©
2026 Astronomy Image Explorer. All Rights Reserved.
