

Image Details
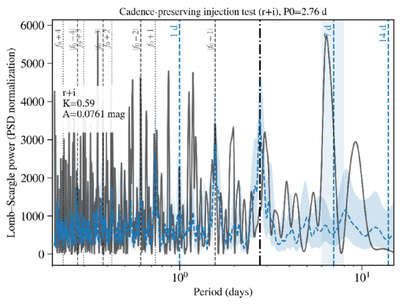
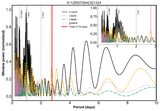
Caption: Figure 8.
Lomb–Scargle alias injection test for the combined r + i light curve of the high-confidence QhX candidate with P0 = 2.76 days, marked by the black dashed–dotted vertical line. The dark gray curve shows the observed combined r + i Lomb–Scargle periodogram (power spectral density normalization), while the dashed blue curve and shaded region indicate the median and 16th–84th percentile range from ﹩{N}_{{\rm{sim}}}=5000﹩ OU+sinusoid simulations sampled at the exact observation times. Vertical gray lines mark the expected diurnal alias locations, ∣f0 ± n day−1∣ (J. T. VanderPlas 2018), illustrating how the survey cadence redistributes power into characteristic alias peaks around the injected period.
Other Images in This Article
Show More
Copyright and Terms & Conditions
© 2026. The Author(s). Published by the American Astronomical Society.

