

Image Details
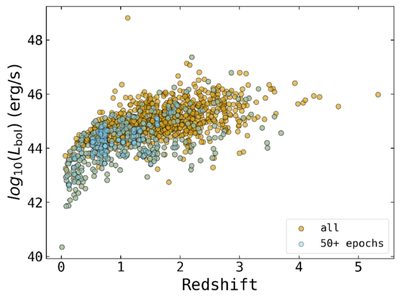
Caption: Figure 4.
Bolometric luminosity–redshift distribution of the LSST DP1 quasar sample. Golden points show the full sample, while blue points indicate the subsample with at least 50 epochs in the LSST g, r, i, and z bands used in the time-domain analysis. The overall trend reflects the flux-limited nature of the parent catalogs.
Other Images in This Article
Show More
Copyright and Terms & Conditions
© 2026. The Author(s). Published by the American Astronomical Society.

Copyright ©
2026 Astronomy Image Explorer. All Rights Reserved.
