

Image Details
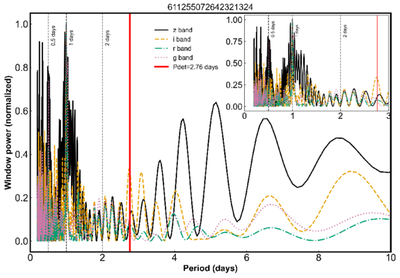
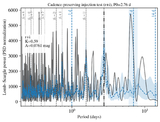
Caption: Figure 7.
Spectral window function of source 611255072642321324 across the g, r, i, and z bands. The curves show the normalized power spectrum of the discrete sampling pattern in each band, illustrating how the observational cadence redistributes signal power across frequencies. The gray vertical line marks the QhX-detected period, ﹩{P}_{{\rm{\det }}}=2.76﹩ days, while the black dashed vertical lines indicate the principal aliases associated with observing patterns at 0.5, 1, and 2 days. Inset: zoom of the sub–3 day region, showing the dense alias structure common to all bands and dominated by diurnal sampling and its harmonics.
Other Images in This Article
Show More
Copyright and Terms & Conditions
© 2026. The Author(s). Published by the American Astronomical Society.

