

Image Details
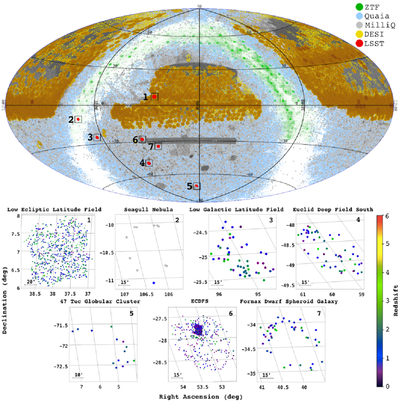
Caption: Figure 1.
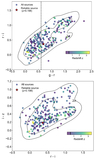
LSST DP1 sky map overplotted with the distribution of AGN from external catalogs that are cross-matched with LSST DP1 sources in seven fields (red circles with labels 1 to 7), shown in equatorial coordinates (J2000.0). The top panel illustrates the selection geometry of the analyzed sample with respect to the external AGN catalogs used in the crossmatch, highlighting the restricted DP1 footprint. The lower panels are insets of these fields, including the field-level distribution of the cross-matched AGN, color coded by redshift; sources without available redshift measurements are shown in gray.
Other Images in This Article
Show More
Copyright and Terms & Conditions
© 2026. The Author(s). Published by the American Astronomical Society.

