

Image Details
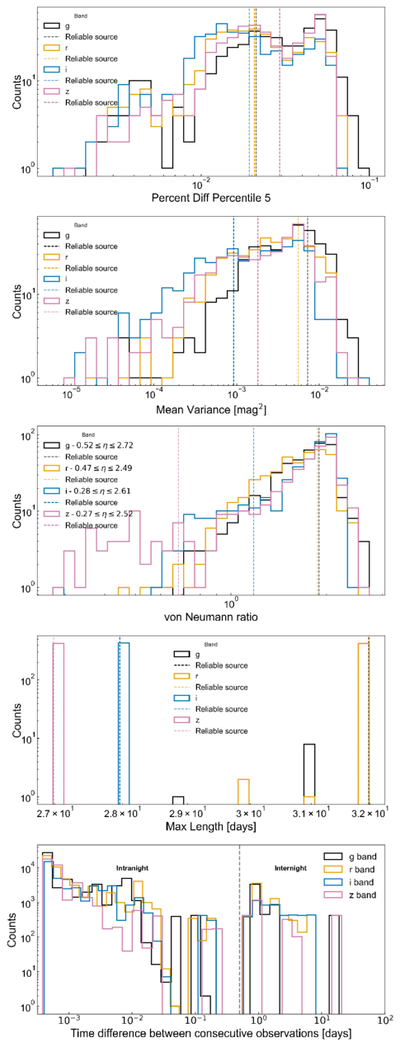
Caption: Figure 5.
Distributions of selected light-curve properties in different photometric bands. From top to bottom: amplitude, mean variance, von Neumann ratio, continuous observing-window length in days, and time differences between consecutive observations. In the first four panels, dashed lines indicate the value for the detected candidate (Section 4). In the bottom panel, the gray dashed line marks the separation between intranight and internight cadences.
Other Images in This Article
Show More
Copyright and Terms & Conditions
© 2026. The Author(s). Published by the American Astronomical Society.

Copyright ©
2026 Astronomy Image Explorer. All Rights Reserved.
