

Image Details
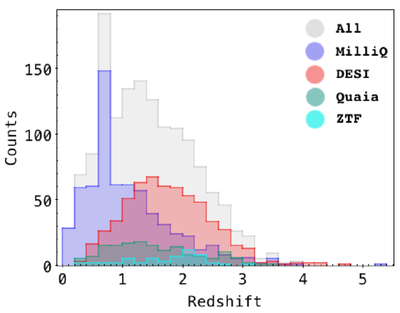
Caption: Figure 3.
The redshift distribution of the extracted AGN sample includes 1438 out of 1456 sources contributing to the presented histogram. This sample resulted from cross-matching LSST DP1 data with publicly available external AGN catalogs. The gray histogram represents the entire sample, while the colored histograms show the redshift distributions of subsamples based on the external catalogs from which the AGN were extracted. The LSST DP1 AGN cover 0.01 < z < 5.33. The vast majority of selected objects (1417) have spectroscopic and only 21 have photometric redshifts.
Other Images in This Article
Show More
Copyright and Terms & Conditions
© 2026. The Author(s). Published by the American Astronomical Society.

Copyright ©
2026 Astronomy Image Explorer. All Rights Reserved.
