

Image Details
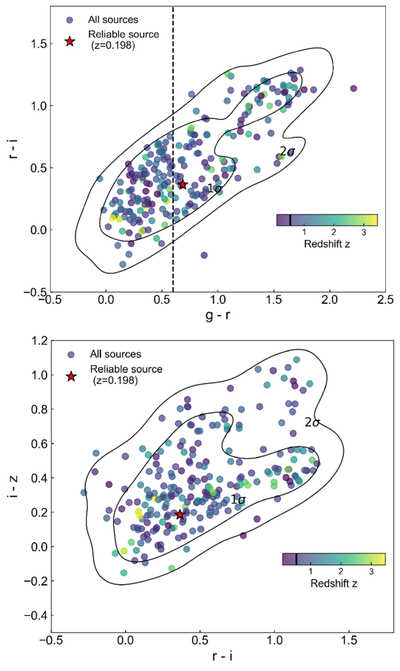
Caption: Figure 10.
Distributions of the studied sample in the g − r versus r − i (top) and r − i versus i − z (bottom) spaces. The color bar shows the redshift of the sources. Contour lines show the 68% and 95% highest-density regions derived from the two-dimensional kernel density estimate. The red star represents the only source classified as reliable and is within 1σ from the mean locus in both cases. The dashed vertical line (top plot) marks the empirical color division g − r = 0.6 adopted by P. Sánchez-Sáez et al. (2019), separating blue (g − r ≤ 0.6) from redder AGN (g − r > 0.6). The black stripe on the color bar indicates the redshift of the reliable source.
Other Images in This Article
Show More
Copyright and Terms & Conditions
© 2026. The Author(s). Published by the American Astronomical Society.

